
Transport
Complement IoT data sources with real time computer vision to enhance operational efficiency, elevate safety and improve the commuter experience.


Connect
Connect street, station and trailer cameras into one secure platform for live analytics.
Analyze
Leverage an existing catalogue of AI Apps or build and deploy AI/ML for new use cases.

Action
Transform operations and future planning with visual insights based data through our secure API connector.
Harness the power of real-time data
Make insight based decisions and gain valuable input for strategic planning

Trains

Buses

Light rail

Ferries

Roads

City Planning
Make evidence-based decisions to plan and improve the quality of life for the citizenry:
Commuter movements
Walkway and crosswalk usage
Vision Zero
Large event analysis
Commercial and residential audits
Commercial and non-commercial curb activity
Vehicle pick-up and drop-off events


Transportation
Measure operational efficiency with the visualised understanding of transport utilisation:
Passenger counts
Distance traveled
Rail network usage
Analyze multi-modal transportation: bicycles, bikes, scooters
Maintenance and track work
Facilities management


Parking
Supplement and/or replace parking sensors with vision based detection:
Measure parking utilization
Identify parking violations
Geo-locate parked vehicle locations
Measure impact of street parking on traffic
Deliver information on parking spots to smart signage


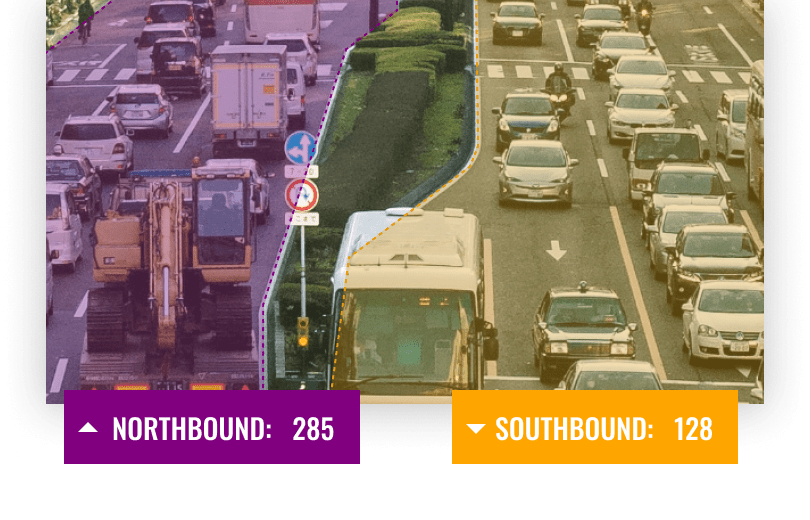
Traffic
Collect traffic data for optimized utilization of the roadway systems, improved safety and for future planning
Count and classify vehicles
Conduct traffic studies
Measure traffic corridor flow
Intersection analysis
Understand lane usage patterns
Vehicle turning and stop times
Determine near miss hot spots for conditional changes
Instant data and notifications for your smart signage


Don’t see your use case listed?
Leverage Unleash live to deploy new capabilities
A Guide to Understanding and Adhering to New Passenger Counting Regulations
Discover how to improve passenger counting accuracy and efficiency with computer vision and a seamless digital workflow.

“I'm excited to see how we can leverage the system resources and bring innovation to the conversation about public safety.”
Assistant Director | Miami-Dade County Dept. of Transport & Public Works
CASE STUDY
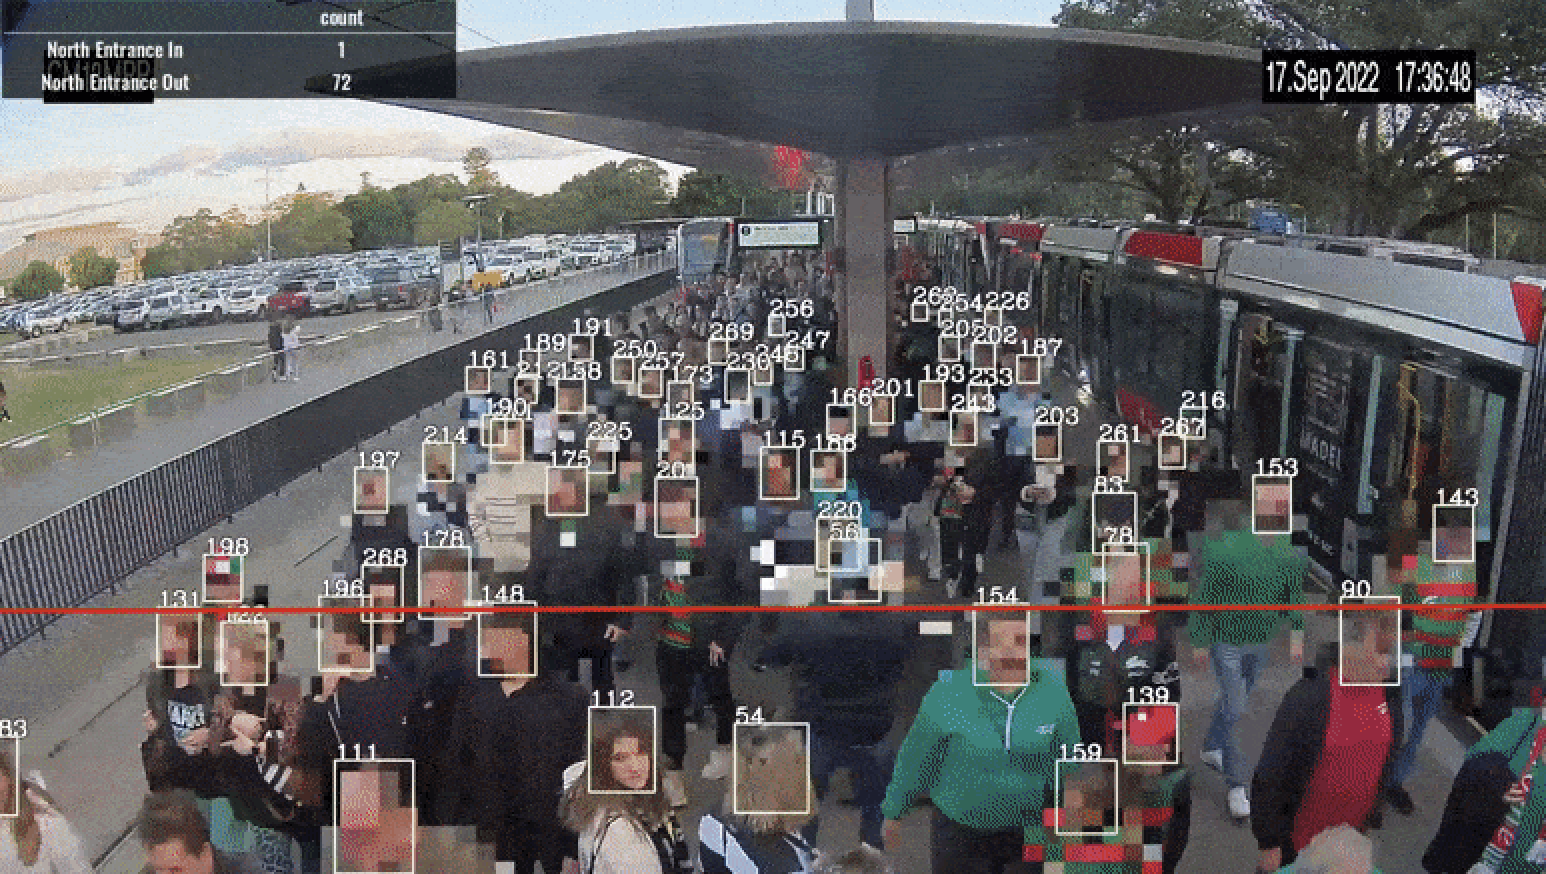
Transport for NSW
Utilized existing CCTV technology and computer vision to quantify passenger utilisation at Sydney’s Light Rail network.
95%+
Accuracy from ground truthing sample data even at times of peak pedestrian traffic

CASE STUDY
The City of Sacramento
2.5X
5X

Pedestrian volume, timing and location data was gathered to guide crosswalk placement at intersections throughout the City.
Increase in process efficiency
Reduction in cost per field investigation
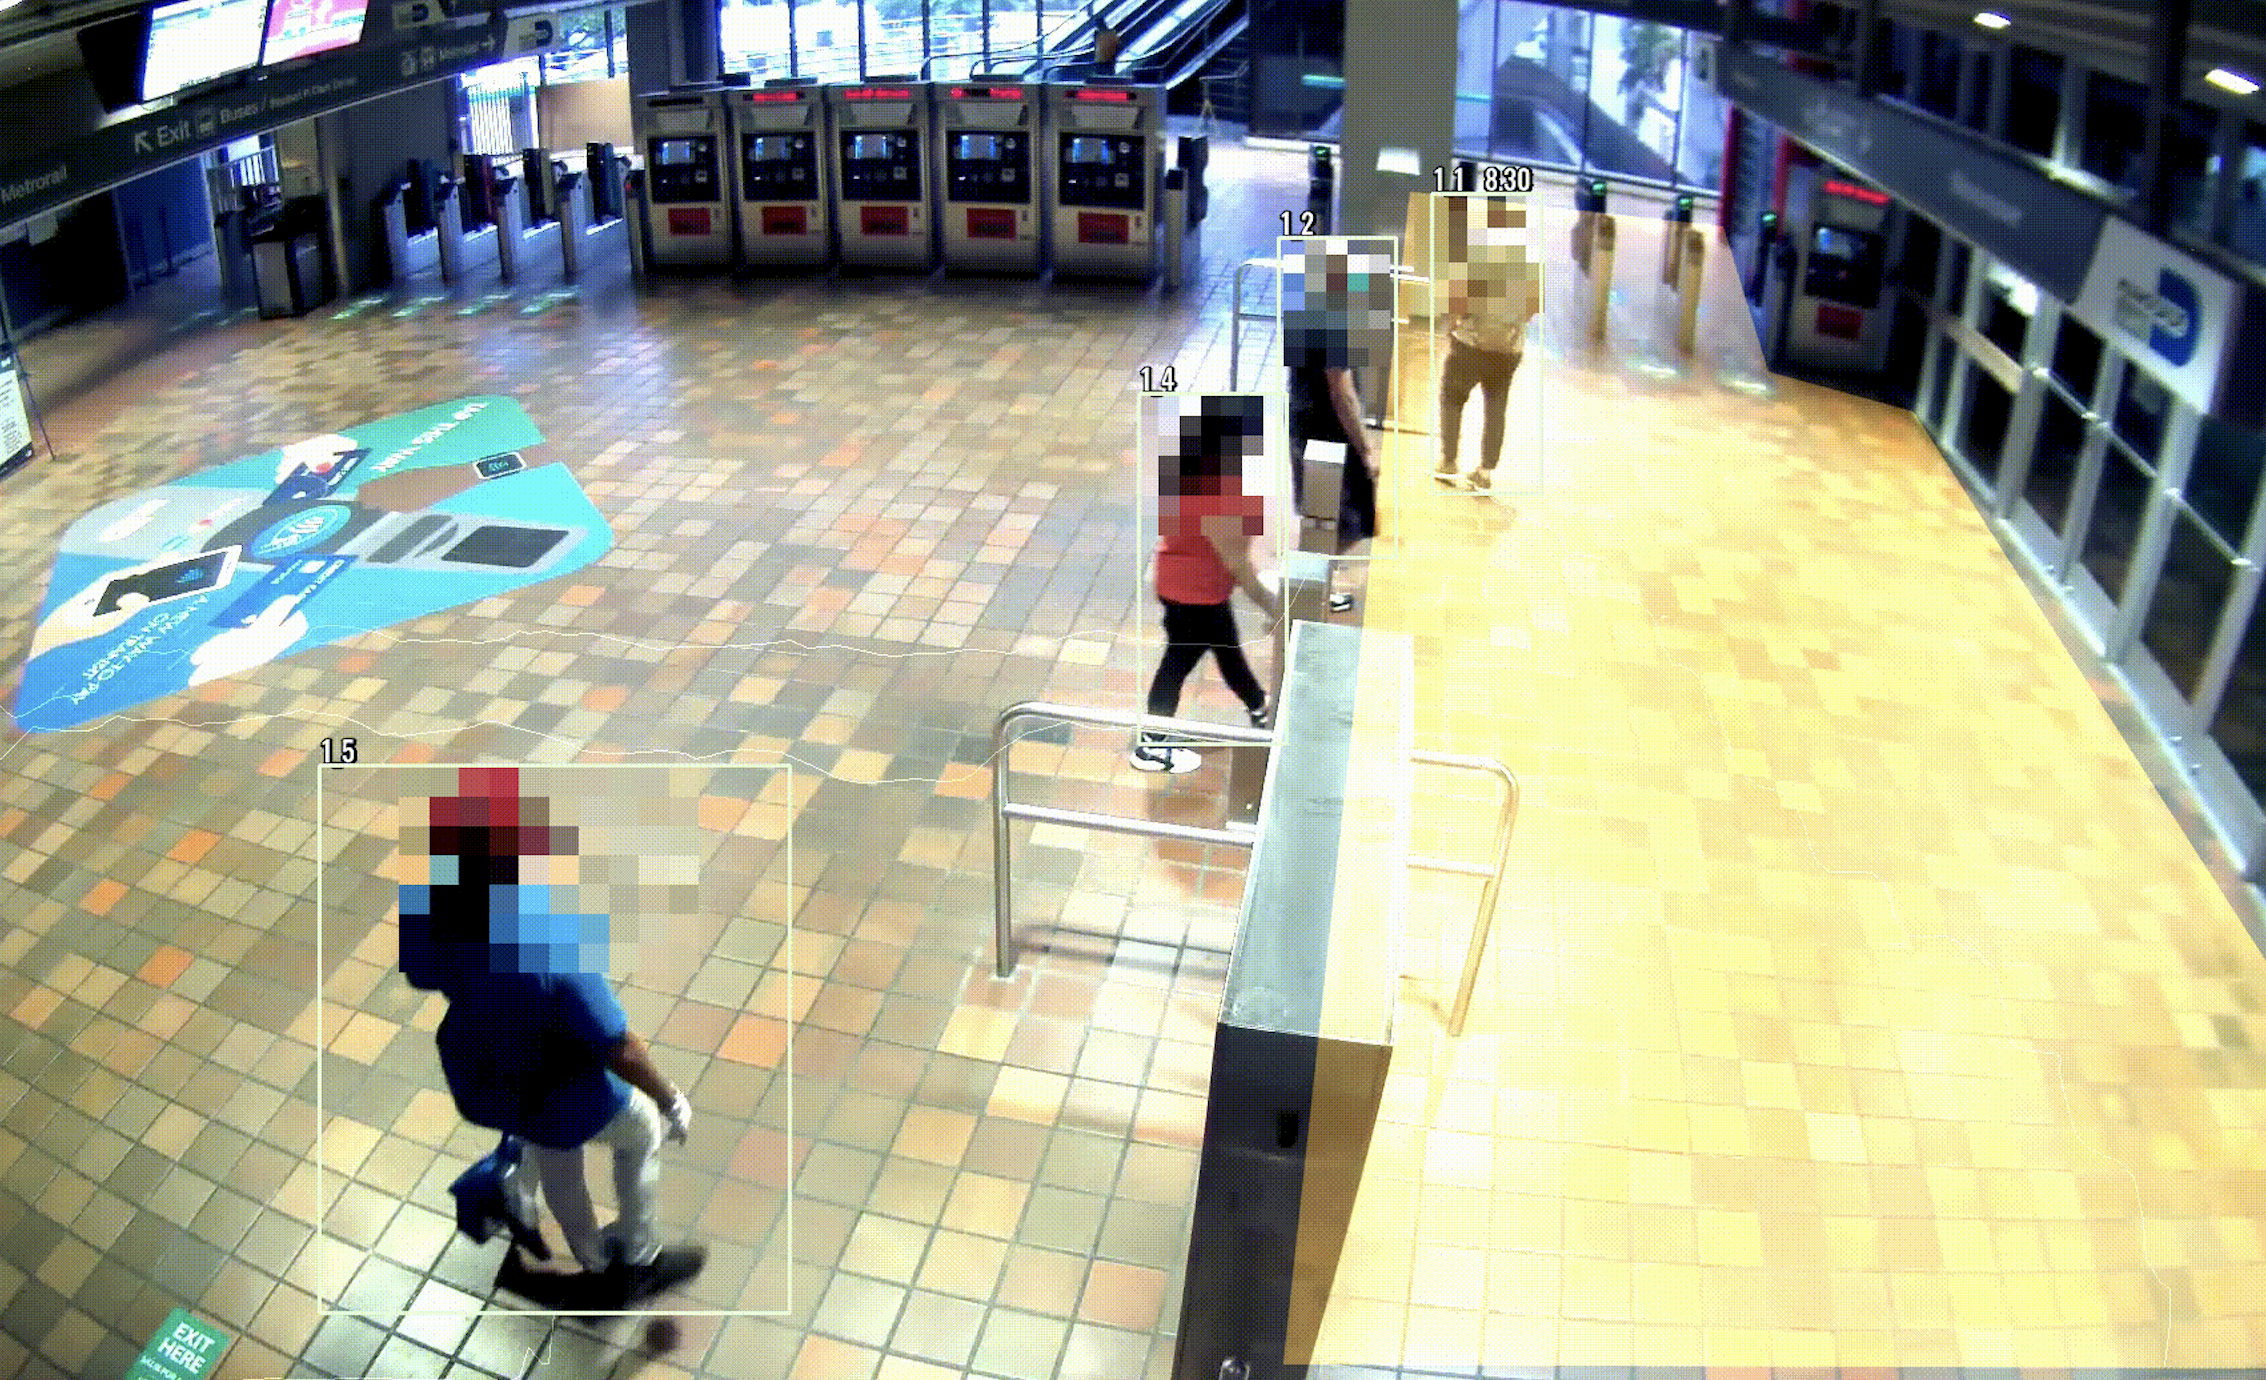
CASE STUDY

Miami - Dade County
Helped Department of Transportation and Public Works count train patronage across 36 stations.
100,000+
Daily commuters
Under 2 weeks
From deployment to insights


Security
Built on world leading infrastructure for secure and scalable deployment as well as ensuring data sovereignty requirements.
Read more
Latest blog posts on Transport