
Measure reality with computer vision.
Some assets slip out of sight, others overload you with data. We turn both into decisions you can act on.
Utilities
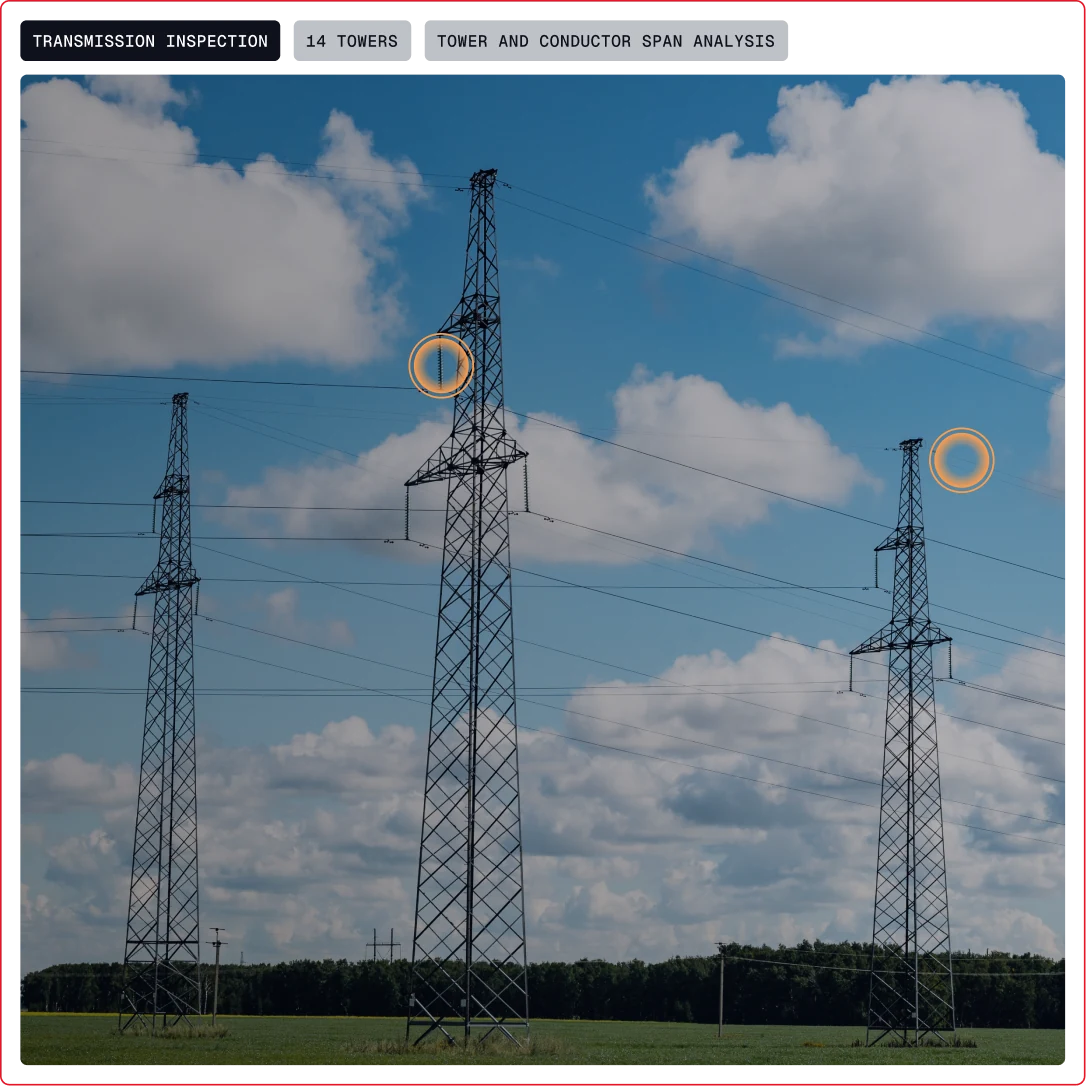
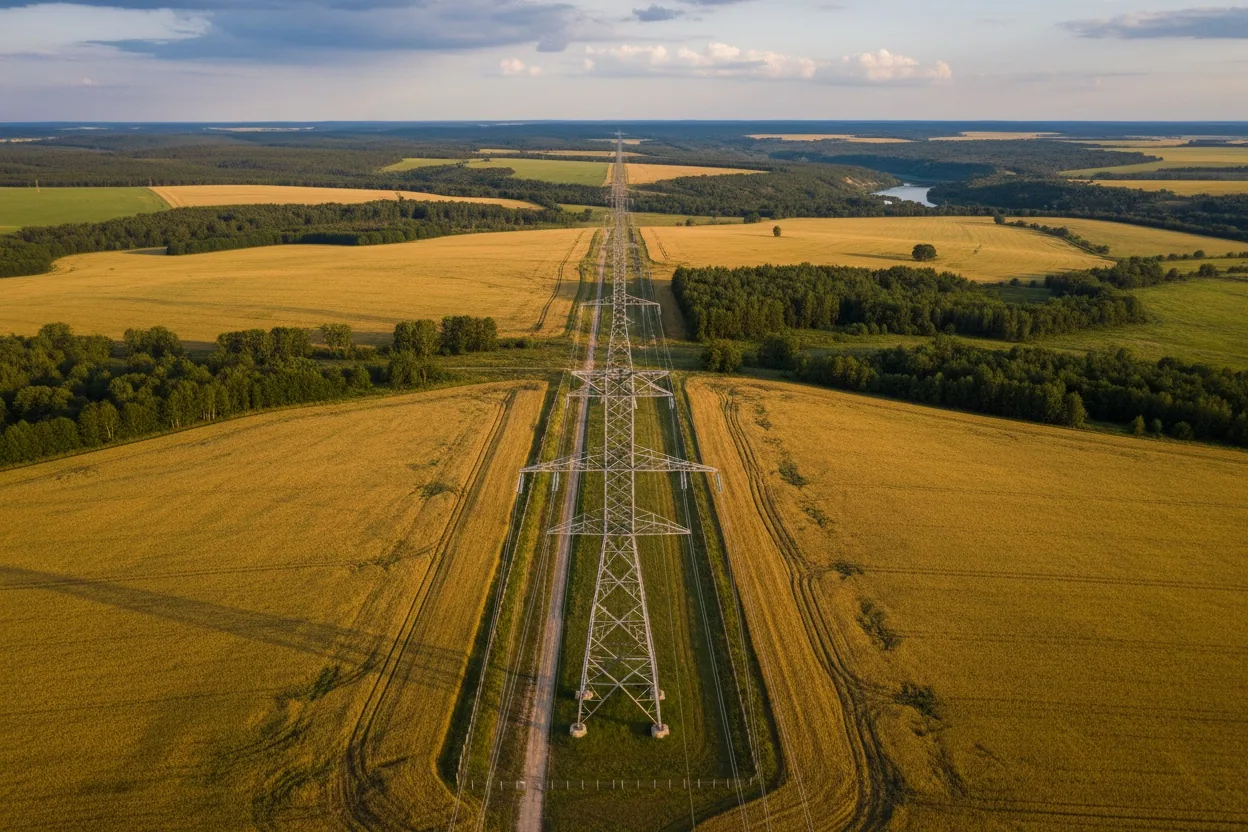
Thousands of poles, lines, and substations, under constant regulatory watch. The answers are already in your visual data.
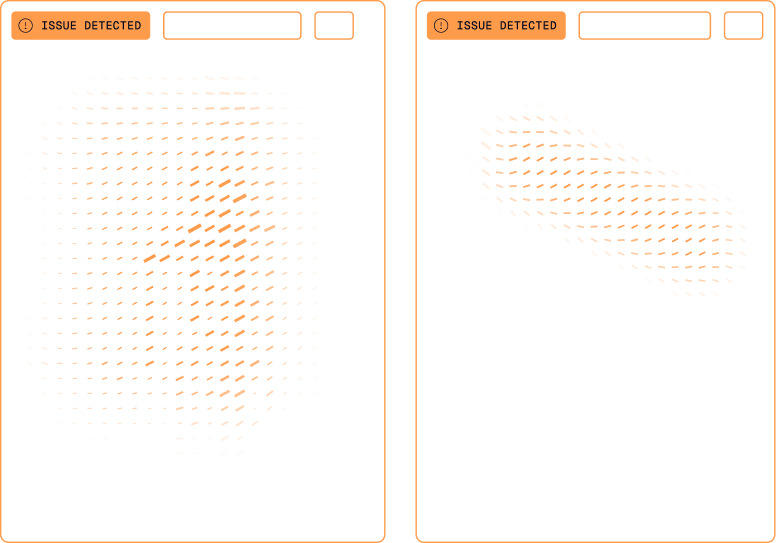
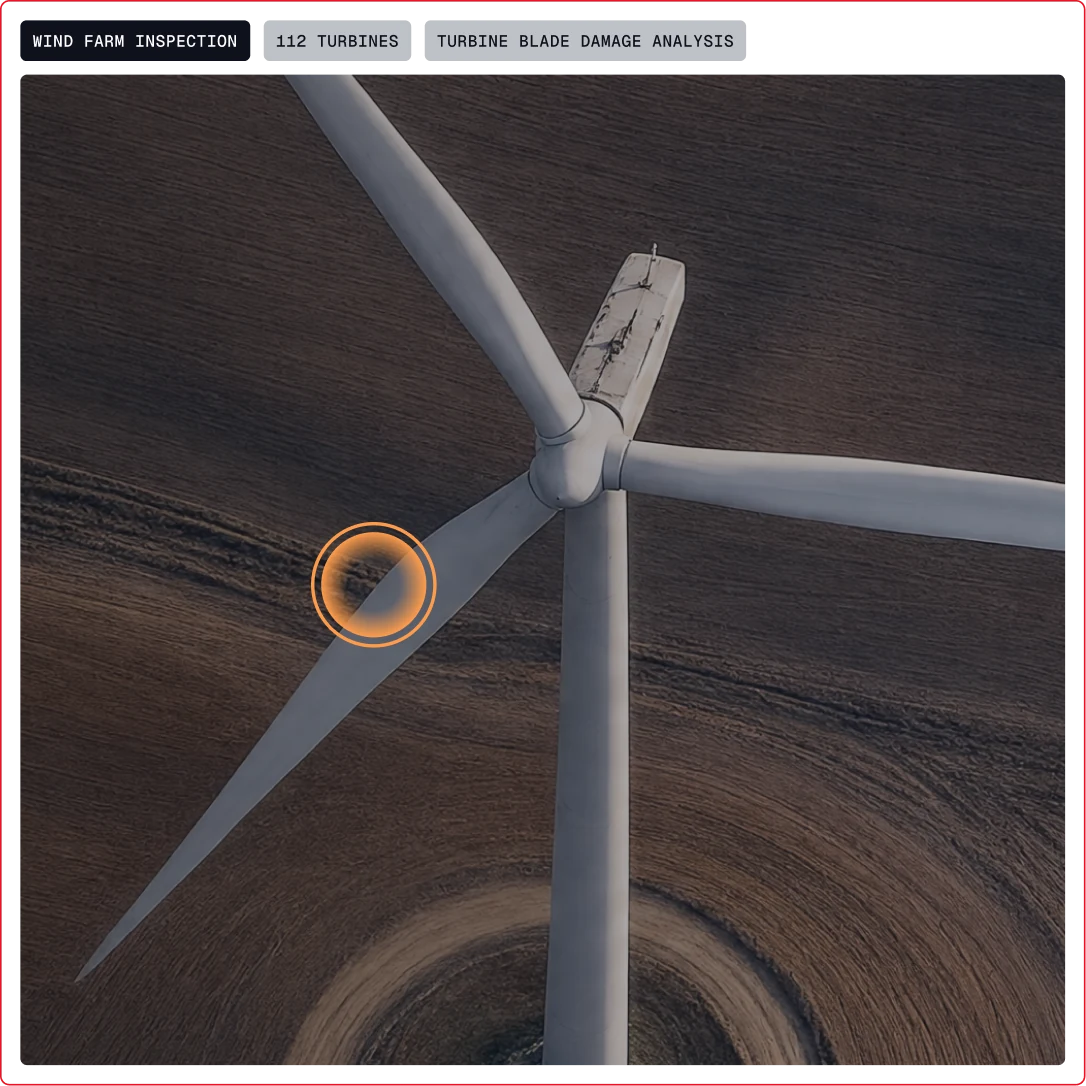
Encroachment, corrosion, faults, computer vision surfaces them while there's still time to act.
Inspection & Maintenance Efficiency
Inspection Cycle Time
0 DAYS•↓ 0%
Inspection Coverage Rate
0%•↑ 0%
Planned Maintenance Ratio
0:0•↑ 0%
From risk to resolution, in three stages.
01 Capture
Visual data is unified and trustworthy
Assets captured to the standard assessment demands: the right angle, the right height, thermal to high-resolution. A clearer picture across your portfolio, on your terms.
02 Analyze
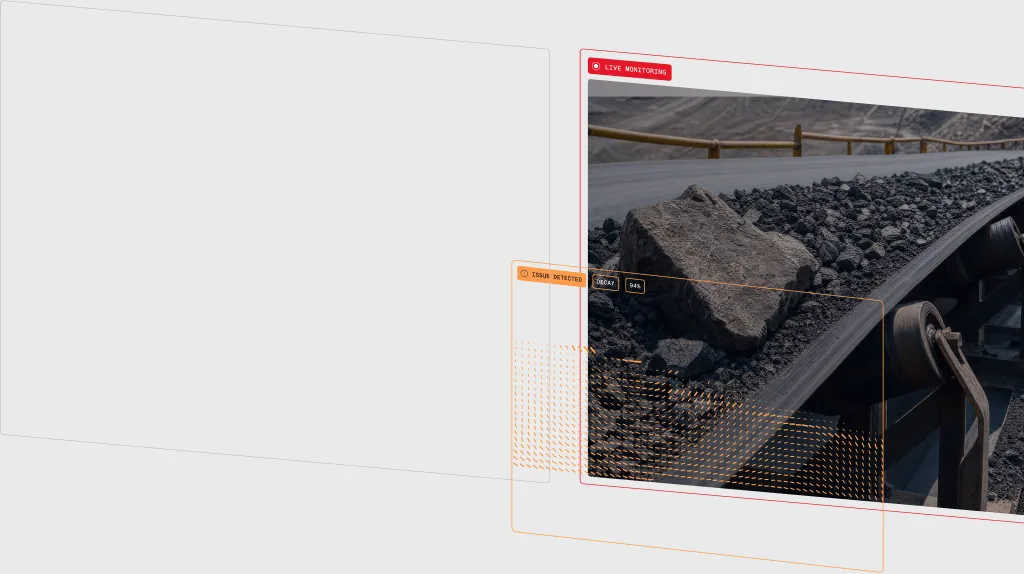

Risks are found early
Computer vision reads every capture for the defects, anomalies, and risks that matter, on schedule or the moment they appear. Expert oversight keeps the AI Apps continually improving, so what you see you can trust.
03 Act
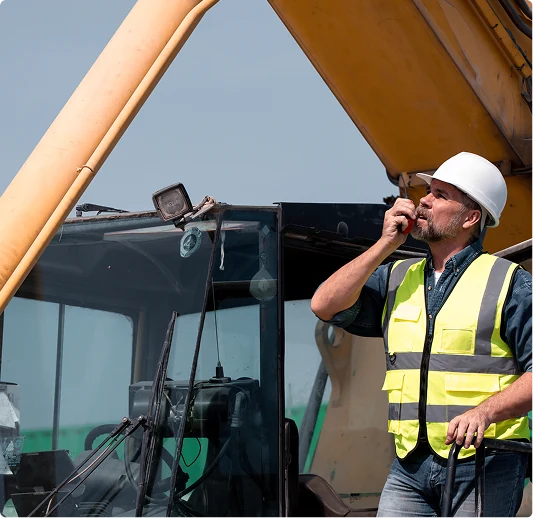

Detection becomes action, fast
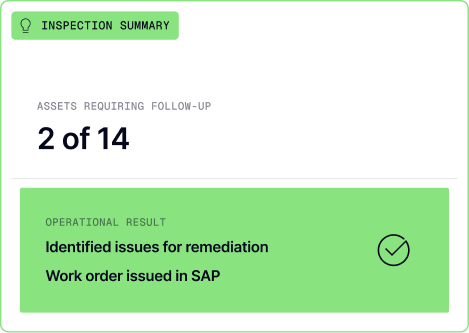
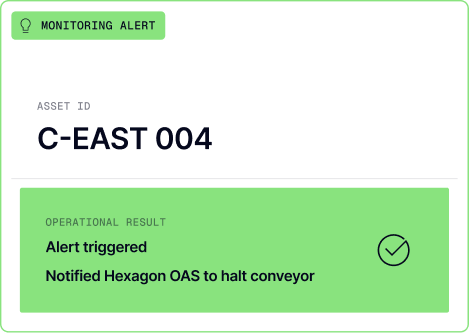
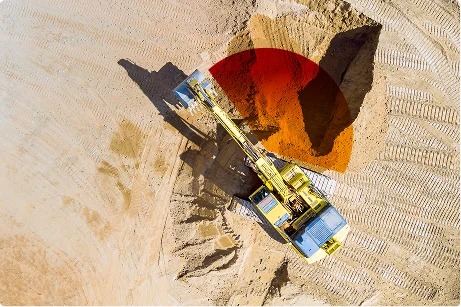
A corrosion flag raises a work order. A compliance gap triggers an alert. A fault routes to the right team, across cloud and edge. Detection becomes action, in the moment it matters most.
trusted by leading operators












Measured in the field
$69B
Value of portfolio we monitor
70%
Reduction in manual inspection effort
97B
Images detected and analyzed
91%
Detected F1-score across deployed AI Apps
FROM A SINGLE SITE TO AN ENTERPRISE-SCALE PROGRAM

